Desmos for SAT Math: A Practical Guide with Worked Examples
Use Desmos when a graph or calculation gives you a clear route to the quantity a question asks for. Start by writing the relationship, then decide whether a graph, direct evaluation or hand algebra makes the work simpler. Check the result against the original conditions. The examples below show how to make that choice, including cases where a graph hides information or supplies only an approximation.
Start here
The College Board calculator policy allows calculators throughout SAT Math and provides embedded scientific and graphing Desmos tools. Practice with the relevant official testing calculator. Its settings and available features can differ from the standard website, as Desmos explains.
This guide works through twelve original examples that show when graphing is efficient and when hand algebra is simpler. Each example includes the exact expression to type, what to inspect on screen, a hand verification, a possible error, and a note on when another method might be better. After the worked examples, you will find six unsolved transfer questions with a compact answer key, a thirty-minute practice session plan, a two-week skills progression, troubleshooting notes, and answers to common questions.
How to Decide Between Hand Algebra and a Graph
The first decision on any SAT Math question is not which button to press. It is whether a graph helps at all. A graph is useful when the question asks about an intersection, a root, a vertex, a maximum or minimum value, a domain restriction, or a point that satisfies an equation. A graph is less useful when the question asks you to simplify an expression, establish expression equivalence, manipulate a formula symbolically, or find an exact value that depends on algebraic structure.
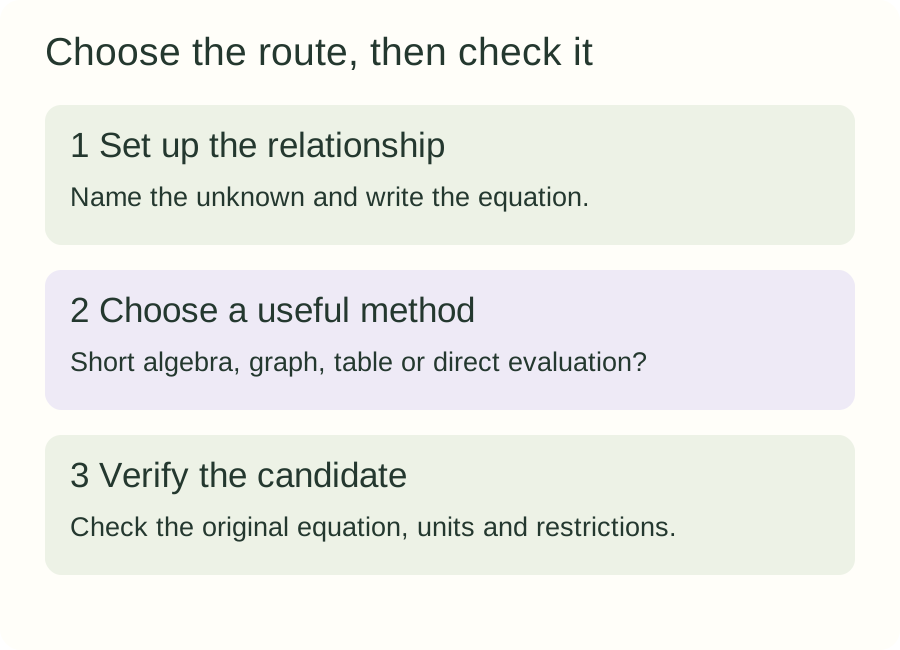
A practical method-choice test is to ask three questions. First, can I write the relationship as one or two equations in x and y? Second, does the answer appear as a visible feature of the graph, such as an intercept, intersection, vertex, or boundary? Third, can I read that feature accurately enough to match an answer choice or grid-in value? If the answer to all three is yes, graphing may be the fastest route. If any answer is no, start with algebra.
Consider a system of two linear equations. You can solve it by substitution or elimination in a few lines. You can also type both equations into Desmos and click the intersection. Both methods work. Graphing may be convenient when both equations are easy to enter and their intersection is visible. Algebra can be shorter when a variable cancels immediately. If a coordinate is rounded, use it as a clue and verify a candidate exactly; the decimal 1.333 alone does not establish that an answer is 4/3.
Consider a quadratic equation like x² - 7x + 12 = 0. You can factor it in seconds. You can also graph y = x² - 7x + 12 and look for x-intercepts. The graph gives the roots directly, but it also shows a y-intercept of 12, which is not a root. A student who glances at the wrong feature can pick 12 instead of 3 or 4. The graph is only as good as your interpretation.
The method-choice table below summarizes common situations.
| Situation | Graph is often efficient | Hand algebra is often simpler |
|---|---|---|
| System of two linear equations with integer intersection | Yes, click intersection | Also fine, substitution or elimination |
| Quadratic roots with integer values | Yes, inspect x-intercepts | Factor if possible |
| Vertex or maximum of a quadratic | Yes, inspect vertex | Complete the square or use -b/(2a) |
| Rational equation with a domain exclusion | Risky, hole may be invisible | Simplify and check domain |
| Absolute value equation | Yes, intersection of V-shape and horizontal line | Split into two cases |
| Linear inequality | Yes, shaded region and boundary | Isolate variable and note strictness |
| Function evaluation at a single input | Yes, type f(-2) if f is defined | Substitute directly |
| Expression transformation like f(x+1) | No, graph does not show symbolic form | Substitute and simplify |
| Radical equation with extraneous roots | Risky, graph may not show rejection reason | Square and check each candidate |
| Exponential equation | Inspect an intersection or evaluate a candidate | Recognize simple powers when available |
| Circle center and radius | Yes, inspect equation form | Complete the square if needed |
| Word problem with units | Yes, graph both sides and interpret units | Write and solve the equation |
The table is a starting point, not a rule. Your goal is to choose the method that minimizes setup time and error risk for the specific problem in front of you.
Practicing with the Test Version
Use the exam-specific calculator when learning the interface. Desmos explains that testing versions restrict features such as importing, saving or sharing graphs and linking to outside resources. Feature configurations can change, so check the current testing version rather than relying on an old list of shortcuts or restrictions. This guide uses basic graphing and evaluation; it does not require a saved graph or a personal account.
The official Bluebook practice page offers full-length adaptive practice tests. These tests include the embedded calculator and the My Practice review feature. The original examples in this article are not official test questions and have no scaled-score conversion. They are instructional material designed to show method choice and verification.
When you practice, type expressions exactly as you would on test day. Use parentheses around numerators, denominators, exponents, and negative signs. Check the graph window. If an intercept or intersection is not visible, adjust the scale or solve algebraically. Do not assume the default window shows everything you need.
Exact Entries and Output Interpretation
A graphing calculator only knows what you type. If you type x² - 7x + 12, Desmos interprets it as x squared minus 7x plus 12. If you type x^2 - 7x + 12, you get the same graph. For (x^2 - 16)/(x - 4), the allowed points lie on the line y = x + 4, with x = 4 excluded. The missing point may be difficult to see. You need to know the domain restriction from the algebra, not from the picture.
Make the grouping explicit. Use (1/2)*x for one half times x and 1/(2*x) for one divided by twice x. Inspect the rendered fraction to confirm which expression you entered. For a radical, compare sqrt(x + 5) with sqrt(x) + 5: the first puts x + 5 under the radical; the second adds 5 afterward. Do not rely on a remembered typing sequence if the displayed expression groups the terms differently.
Negative signs also matter. The expression -2(x - 3)² + 19 is not the same as (-2(x - 3))² + 19. The first is a downward-opening parabola with vertex (3, 19). The second is an upward-opening parabola with a different shape. Type the negative sign outside the parentheses exactly as the problem states.
The output on screen is a picture, not an answer. An x-intercept at x = 3 means the function value is zero when x is 3. A y-intercept at y = 12 means the function value is 12 when x is 0. An intersection at (4, 3) means both equations are true when x is 4 and y is 3. A vertex at (3, 19) means the function reaches its maximum or minimum value of 19 when x is 3. Each feature has a specific meaning, and you must map that meaning back to the question.
Treat rounded coordinates as approximate evidence. Several different exact numbers can round to the same displayed decimal. If a question asks for an exact fraction, derive it algebraically or substitute a proposed fraction into the original equation. If the question explicitly requests a rounded answer, use the requested precision. A graph can suggest where to look without settling every digit.
Worked Example 1: System of Two Linear Equations
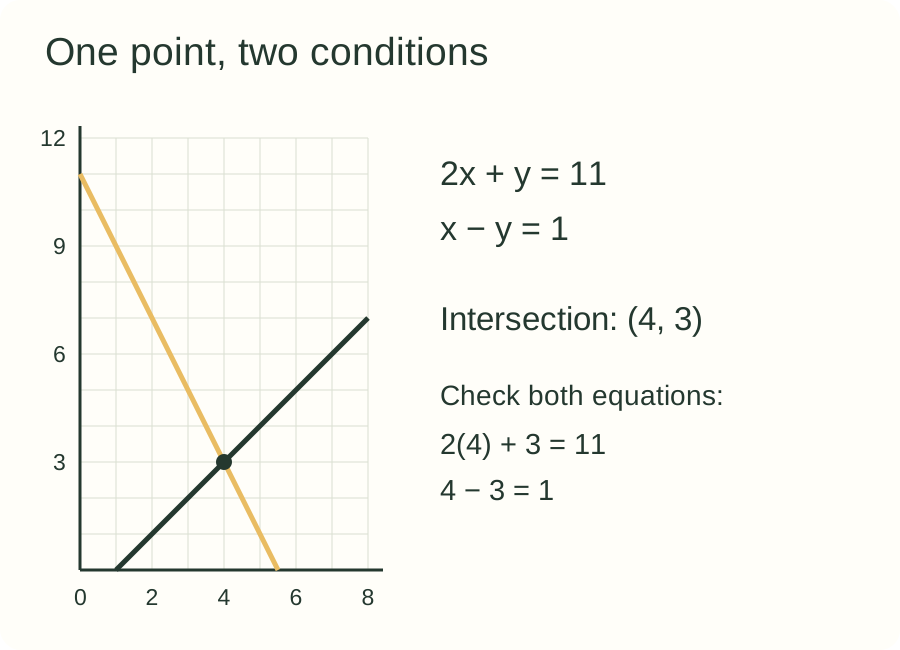
Problem: Solve the system 2x + y = 11 and x - y = 1.
Typed expressions: Enter 2x + y = 11 on one line and x - y = 1 on the next line.
What to inspect: The graph shows two lines. Click the intersection point. Desmos displays the coordinates (4, 3).
Hand verification: Substitute x = 4 and y = 3 into the first equation. 2(4) + 3 = 8 + 3 = 11, which matches. Substitute into the second equation. 4 - 3 = 1, which matches. Both equations are satisfied.
Possible error: Entering the second equation as x - y = -1 or x + y = 1 changes the intersection. A sign error in setup produces a wrong point that still looks plausible on screen. Check each equation against the problem before clicking.
When another method is simpler: If the intersection had fractional coordinates like (10/3, 13/3), the graph might show decimals. Elimination gives the exact fractions directly. For this problem, both methods are fast, and the graph provides a visual check.
Worked Example 2: Roots of a Quadratic
Problem: Find the solutions to x² - 7x + 12 = 0.
Typed expression: Enter y = x^2 - 7x + 12.
What to inspect: The graph is a parabola opening upward. The x-intercepts are at x = 3 and x = 4. These are the points where y equals zero.
Hand verification: Factor the quadratic as (x - 3)(x - 4). Setting each factor to zero gives x = 3 and x = 4. Substituting x = 3 gives 9 - 21 + 12 = 0. Substituting x = 4 gives 16 - 28 + 12 = 0.
Possible error: The y-intercept is 12. A student who looks at the wrong axis might report 12 as a root. The roots are x-intercepts, not the y-intercept. The graph shows both features, and you must select the correct one.
When another method is simpler: Factoring takes less time than typing the equation and adjusting the window. If the quadratic factors easily, do the algebra. If the roots are irrational, the graph gives an approximate location, and the quadratic formula gives the exact values.
Worked Example 3: Vertex of a Quadratic
Problem: Find the vertex of y = -2(x - 3)² + 19 and state the maximum value.
Typed expression: Enter y = -2(x - 3)^2 + 19.
What to inspect: The graph is a parabola opening downward. Click the vertex. Desmos displays the point (3, 19). The y-coordinate 19 is the maximum value of the function.
Hand verification: The vertex form of a quadratic is y = a(x - h)² + k, where (h, k) is the vertex. Here a = -2, h = 3, and k = 19. The vertex is (3, 19). Since a is negative, the parabola opens downward and the vertex is a maximum. The maximum value is 19.
Possible error: Interpreting the x-coordinate 3 as the maximum value. The maximum value is the y-coordinate, 19. The x-coordinate is the input at which the maximum occurs. If a word problem asks for the maximum height, the answer is 19, not 3. If it asks when the maximum occurs, the answer is 3. The context determines which coordinate to report.
When another method is simpler: The equation is already in vertex form, so reading the vertex directly is faster than graphing. The graph confirms the answer and shows the downward opening, but the algebra is immediate.
Worked Example 4: Fixed-Rate Comparison
Problem: A service charges a fixed fee of 6 dollars plus 1.5 dollars per unit. Another option charges a flat 21 dollars. At what number of units do the two options cost the same?
Typed expressions: Enter y = 1.5x + 6 and y = 21.
What to inspect: The first expression is a line with slope 1.5 and y-intercept 6. The second is a horizontal line at y = 21. The intersection is at (10, 21).
Hand verification: Set 1.5x + 6 = 21. Subtract 6 from both sides to get 1.5x = 15. Divide by 1.5 to get x = 10. The cost is 1.5(10) + 6 = 15 + 6 = 21 dollars. Both options cost 21 dollars at 10 units.
Possible error: Reporting 21 as the number of units. The input x is the number of units, which is 10. The output y is the cost in dollars, which is 21. The coordinates represent different quantities, and the question asks for the input.
When another method is simpler: The equation 1.5x + 6 = 21 solves in two steps. The graph is helpful for visualizing the comparison, but the algebra is direct. Use the graph if the equation is more complex or if you want a visual check.
Worked Example 5: Rational Equation with a Domain Hole
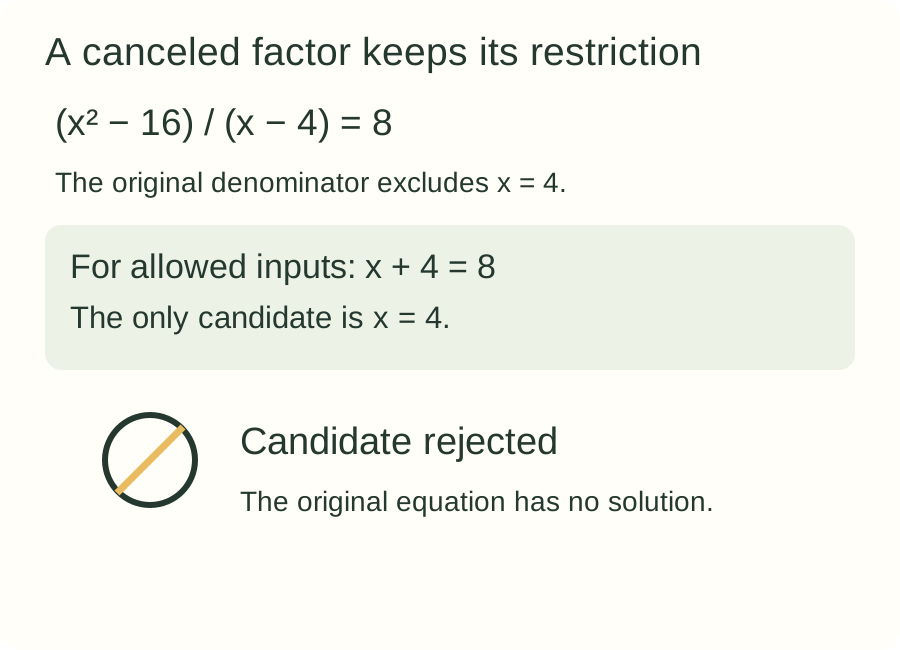
Problem: Solve (x² - 16)/(x - 4) = 8.
Typed expression: Enter y = (x^2 - 16)/(x - 4) and y = 8.
What to inspect: The graph of the rational expression looks like the line y = x + 4, but it has a hole at x = 4 because the denominator is zero there. The horizontal line y = 8 intersects the simplified line at x = 4, but that point is not on the original rational expression.
Hand verification: Factor the numerator as (x - 4)(x + 4). The expression simplifies to x + 4 for all x not equal to 4. Setting x + 4 = 8 gives x = 4. However, x = 4 is excluded from the domain because it makes the original denominator zero. The original equation has no solution.
Possible error: The graph may not show the hole at the default zoom. A student who sees the line and the intersection at (4, 8) might report x = 4 as the solution. The hole is a domain restriction that the picture can hide. Always check the denominator before simplifying.
When another method is simpler: Algebra is essential here. The graph can mislead if the hole is invisible. Simplify the expression, note the domain restriction, and check any candidate solution against the original equation.
Worked Example 6: Absolute Value Equation
Problem: Solve |2x - 5| = 7.
Typed expressions: Enter y = abs(2x - 5) and y = 7.
What to inspect: The graph of y = abs(2x - 5) is a V-shape with its vertex at x = 2.5. The horizontal line y = 7 intersects the V at two points: x = 6 and x = -1.
Hand verification: Split the absolute value equation into two cases. First, 2x - 5 = 7. Add 5 to get 2x = 12, so x = 6. Second, 2x - 5 = -7. Add 5 to get 2x = -2, so x = -1. Check both. For x = 6, |2(6) - 5| = |12 - 5| = |7| = 7. For x = -1, |2(-1) - 5| = |-2 - 5| = |-7| = 7.
Possible error: Forgetting the second case and reporting only x = 6. Absolute value equations often have two solutions. The graph shows both intersections, which helps avoid the omission.
When another method is simpler: The two-case algebra is straightforward and gives exact answers. The graph is a good check, especially for verifying that two solutions exist.
Worked Example 7: Linear Inequality
Problem: Solve 2x + 3 < 11.
Typed expression: Enter y = 2x + 3 and y = 11, or enter the inequality 2x + 3 < 11 directly if the testing calculator supports it.
What to inspect: The line y = 2x + 3 is below the horizontal line y = 11 for x values less than 4. The boundary at x = 4 is not included because the inequality is strict.
Hand verification: Subtract 3 from both sides to get 2x < 8. Divide by 2 to get x < 4. The solution is all real numbers less than 4. The value x = 4 gives 2(4) + 3 = 11, which does not satisfy the strict inequality.
Possible error: Reporting x ≤ 4 instead of x < 4. A shaded graph may not clearly show whether the boundary is included. The strict inequality symbol means 4 is not a solution. Check the original inequality with x = 4 to confirm.
When another method is simpler: Isolating the variable takes one line. The graph is useful for visualizing the solution set, but the algebra is faster and avoids boundary ambiguity.
Worked Example 8: Function Evaluation and Transformation
Problem: For f(x) = x² - 3x + 2, find f(-2) and f(x + 1).
Typed expression: For the first part, enter f(x) = x^2 - 3x + 2 and then f(-2). For the second part, the graph does not directly show the symbolic form of f(x + 1).
What to inspect: Desmos evaluates f(-2) as 12. The graph of f(x) shows the point (-2, 12) on the parabola. For f(x + 1), you could graph y = f(x + 1) and compare it to y = f(x), but the graph shows a shifted parabola, not the simplified expression.
Hand verification: For f(-2), substitute -2 into the function. (-2)² - 3(-2) + 2 = 4 + 6 + 2 = 12. For f(x + 1), substitute x + 1 into the function. (x + 1)² - 3(x + 1) + 2 = x² + 2x + 1 - 3x - 3 + 2 = x² - x. Note that f(x + 1) is not the same as f(x) + 1. f(x) + 1 would be x² - 3x + 3.
Possible error: Confusing f(x + 1) with f(x) + 1. The first means substitute x + 1 for every x in the function. The second means evaluate f(x) and then add 1. These are different operations with different results.
When another method is simpler: Substitution and simplification give the symbolic expression directly. The graph can show that the function shifts, but it does not give the simplified expression. Use algebra for transformations.
Worked Example 9: Radical Equation with Extraneous Root
Problem: Solve sqrt(x + 5) = x - 1.
Typed expressions: Enter y = sqrt(x + 5) and y = x - 1.
What to inspect: The graph of y = sqrt(x + 5) is the upper half of a sideways parabola starting at x = -5. The line y = x - 1 intersects it at x = 4. The correctly entered original graphs have no intersection at x = -1. That extra candidate appears when the equation is squared, not when the original square-root relationship is graphed correctly.
Hand verification: Square both sides to get x + 5 = (x - 1)². Expand the right side to get x + 5 = x² - 2x + 1. Rearrange to get x² - 3x - 4 = 0. Factor as (x - 4)(x + 1) = 0. The candidates are x = 4 and x = -1. Check x = 4 in the original equation. sqrt(4 + 5) = sqrt(9) = 3, and 4 - 1 = 3. This works. Check x = -1. sqrt(-1 + 5) = sqrt(4) = 2, but -1 - 1 = -2. The right side is negative, so the equation fails. The only solution is x = 4.
Possible error: Accepting x = -1 because it satisfies the squared equation. Squaring both sides can introduce extraneous solutions. The original equation requires the right side x - 1 to be nonnegative, so x must be at least 1. The candidate x = -1 violates that condition.
When another method is simpler: The graph shows the valid intersection at x = 4, but the extraneous root requires algebraic checking. Use the graph to locate candidates and algebra to verify them.
Worked Example 10: Exponential Equation
Problem: Solve 80(1.5)^x = 270.
Typed expressions: Enter y = 80(1.5)^x and y = 270.
What to inspect: The exponential curve starts at y = 80 when x = 0 and increases. The horizontal line y = 270 intersects the curve at x = 3.
Hand verification: Substitute x = 3 into the left side. 80(1.5)³ = 80(3.375) = 270. The equation holds. For a less convenient exponent, a graph or numerical evaluation may supply the precision the question requests; an exact logarithmic expression is a separate algebraic route when appropriate.
Possible error: Assuming the solution is 270 divided by 80, which is 3.375, and reporting that as x. The value 3.375 is 1.5³, not the exponent. The equation asks for the exponent x, which is 3.
When another method is simpler: For this problem, recognizing that 1.5³ = 3.375 and 80 × 3.375 = 270 gives the answer directly. If the exponent were not an integer, the graph would give an approximate value, and logarithms would provide the exact expression.
Worked Example 11: Circle Equation
Problem: For the circle (x - 2)² + (y + 1)² = 25, find the center, radius, and verify that the point (5, 3) lies on the circle.
Typed expression: Enter (x - 2)^2 + (y + 1)^2 = 25.
What to inspect: The graph shows a circle. The apparent shape depends on the window scale. If the x and y axes have different scales, the circle may look like an ellipse. The equation form gives the exact center and radius.
Hand verification: The standard form of a circle is (x - h)² + (y - k)² = r², where (h, k) is the center and r is the radius. Here h = 2, k = -1, and r² = 25, so r = 5. The center is (2, -1). To check the point (5, 3), substitute into the equation. (5 - 2)² + (3 + 1)² = 3² + 4² = 9 + 16 = 25. The point lies on the circle.
Possible error: Reading the center as (-2, 1) by misapplying the signs. The equation has (x - 2) and (y + 1), so the center is (2, -1). The signs are opposite to the constants inside the parentheses.
When another method is simpler: The equation is already in standard form, so extracting the center and radius is immediate. The graph confirms the shape, but the formula is the reliable source for exact values.
Worked Example 12: Word Problem with Units
Problem: A hire service costs 12 dollars fixed plus 3.5 dollars per hour. If the total cost is 40 dollars, how many hours were hired?
Typed expressions: Enter y = 12 + 3.5x and y = 40.
What to inspect: The line y = 12 + 3.5x has y-intercept 12 and slope 3.5. The horizontal line y = 40 intersects it at x = 8.
Hand verification: Write the equation 12 + 3.5h = 40, where h is the number of hours. Subtract 12 from both sides to get 3.5h = 28. Divide by 3.5 to get h = 8. The cost is 12 + 3.5(8) = 12 + 28 = 40 dollars. The units match: x is hours, y is dollars.
Possible error: Reporting 8 dollars or 40 hours. The input x represents hours, and the output y represents dollars. The question asks for hours, so the answer is 8.
When another method is simpler: The equation solves in two steps. The graph is a useful visual check, especially for confirming that the intersection makes sense in context.
Three Checks Worth Practicing in Their Own Right
A rounded coordinate needs an exact check
Solve 2x + y = 7 and x − y = 1. The intersection is near x = 2.667 and y = 1.667 when displayed to three decimal places. Those readings are useful for locating the point. They are not exact fractions.
Add the original equations to eliminate y. You get 3x = 8, so x = 8/3. Substituting into x − y = 1 gives y = 8/3 − 1 = 5/3. Check both equations: 2(8/3) + 5/3 = 21/3 = 7, and 8/3 − 5/3 = 3/3 = 1. The pair satisfies both conditions exactly.
Now compare x = 2.67. Substituting that rounded number and y = 1.67 gives 2(2.67) + 1.67 = 7.01. The result is close to 7, but it is not 7. Whether that difference matters depends on what the question requests. A decimal response rounded to the nearest hundredth is a different task from choosing an exact ordered pair.
When the answer options contain fractions, do not choose solely by which fraction resembles the screen. Check the option in the equation. This also helps when two choices are close. A reliable calculator habit includes knowing which part of your result is exact and which part is a rounded display.
An empty window can hide an ordinary intersection
Consider a hypothetical relationship y = 0.02x + 180 and the comparison y = 194. A small window centered near the origin can show neither useful part of the problem. That tells you about the view, not the existence of a solution.
Set the expressions equal: 0.02x + 180 = 194. Subtract 180 to get 0.02x = 14, then divide by 0.02 to get x = 700. The intersection is (700, 194). Substitution verifies the result: 0.02(700) + 180 = 14 + 180 = 194.
If you want a visual check, use ranges that contain those coordinates, such as x from 0 to 800 and y from 170 to 200. These are sensible viewing choices for this example, not a universal calculator setup. Another question may require a completely different range.
The line may look steep or shallow depending on how the axes are scaled. Its numerical slope is still 0.02. Measure the relationship with the equation and the axis labels; do not infer a slope from the angle the line makes with the edge of your screen. Here, two lines of algebra were enough to find the answer before any window adjustment.
One matching value does not establish equivalence
Suppose you want to check whether (x − 1)² and x² − 1 are equivalent expressions. At x = 1, both equal zero. A single successful substitution might make the proposed equivalence look convincing. It is not enough.
Try x = 0. The first expression is (0 − 1)² = 1. The second is 0² − 1 = −1. One counterexample disproves the proposed identity. Expand the first expression to see the missing term: (x − 1)² = x² − 2x + 1. It is not x² − 1.
You can graph y = (x − 1)² and y = x² − 1. The graphs meet at x = 1, but they are different curves. Solving for their intersection explains why: x² − 2x + 1 = x² − 1 simplifies to −2x = −2, so x = 1. An intersection means equality at that input; identical expressions must agree at every allowed input.
This distinction matters when a question asks for an equivalent expression rather than a root or an intersection. Use algebra to justify a general equivalence. Use numerical checks to catch a mistake or reject a candidate. Several matching points can increase confidence, but the algebra explains why an expression works throughout its domain.
Six Unsolved Transfer Questions
Try these on your own before checking the answer key. Each question is original instructional material, not an official SAT question.
Solve the system 3x + 2y = 18 and x - y = 1.
Find the x-intercepts of y = x² - 5x + 6.
Find the vertex of y = 3(x + 2)² - 7 and state whether it is a maximum or minimum.
Solve |3x + 4| = 10.
Solve sqrt(2x + 3) = x.
A rental costs 20 dollars fixed plus 2.5 dollars per mile. If the total cost is 70 dollars, how many miles were driven?
Answer Key
Intersection at (4, 3). Check: 3(4) + 2(3) = 12 + 6 = 18, and 4 - 3 = 1.
x-intercepts at x = 2 and x = 3. Factor as (x - 2)(x - 3). Check: 4 - 10 + 6 = 0 and 9 - 15 + 6 = 0.
Vertex at (-2, -7). Since a = 3 is positive, the parabola opens upward and the vertex is a minimum. The minimum value is -7.
Solutions are x = 2 and x = -14/3. Check: |3(2) + 4| = |10| = 10. |3(-14/3) + 4| = |-14 + 4| = |-10| = 10.
Solution is x = 3. Squaring gives 2x + 3 = x², so x² - 2x - 3 = 0, which factors as (x - 3)(x + 1) = 0. Candidates are 3 and -1. Check x = 3: sqrt(9) = 3, and 3 = 3. Check x = -1: sqrt(1) = 1, but -1 ≠ 1. The extraneous root is rejected.
Miles driven is 20. Equation: 20 + 2.5m = 70. Subtract 20 to get 2.5m = 50. Divide by 2.5 to get m = 20. Check: 20 + 2.5(20) = 20 + 50 = 70.
A Thirty-Minute Practice Session
This session uses the worked examples above and the transfer questions. Set a timer for each segment and move on when time is up.
Minutes 0 to 5: Open the Desmos testing graphing calculator at the College Board testing page. Type y = x^2 - 7x + 12 and inspect the x-intercepts. Then type y = -2(x - 3)^2 + 19 and click the vertex. Confirm that you can find both features quickly.
Minutes 5 to 10: Recreate Worked Example 1. Type 2x + y = 11 and x - y = 1. Click the intersection. Verify the coordinates by substitution on paper.
Minutes 10 to 15: Recreate Worked Example 5. Type y = (x^2 - 16)/(x - 4) and y = 8. Zoom in around x = 4. Notice whether the hole is visible. Write the simplification and the domain restriction by hand.
Minutes 15 to 20: Solve Transfer Question 1 using the graph. Then solve it again using elimination. Compare the time and accuracy of both methods.
Minutes 20 to 25: Solve Transfer Question 5 using the graph to locate candidates. Then square the equation and check each candidate by hand. Identify the extraneous root.
Minutes 25 to 30: Solve Transfer Question 6 by writing the equation and solving it algebraically. Then graph both sides as a check. Write one sentence explaining which method you preferred and why.
A Two-Week Skills Progression
This progression builds familiarity with the testing calculator and method choice. It does not guarantee a score increase. Progress depends on your starting point, practice quality, and test-day conditions.
Week 1, Days 1 to 2: Practice typing expressions with correct parentheses and negative signs. Work through Worked Examples 1, 2, and 3. Focus on reading intercepts and vertices accurately.
Week 1, Days 3 to 4: Work through Worked Examples 4, 6, and 7. Focus on intersections and inequality boundaries. Check each solution by substitution.
Week 1, Days 5 to 6: Work through Worked Examples 8, 9, and 10. Focus on function evaluation, extraneous roots, and exponential equations. Write the hand verification for each.
Week 1, Day 7: Review all twelve worked examples. For each one, decide whether you would use the graph or algebra if you saw it fresh. Write one sentence justifying each choice.
Week 2, Days 1 to 2: Solve the six transfer questions without looking at the answer key. Check your answers. For any error, identify whether the mistake was in setup, interpretation, or verification.
Week 2, Days 3 to 4: Use the College Board Student Question Bank to find official practice questions filtered by Algebra and Advanced Math. Practice method choice on those questions. The question bank provides existing official questions and does not generate new ones.
Week 2, Days 5 to 6: If your schedule allows a full Bluebook practice sitting, use its Math work to review calculator choices afterward in My Practice. If you have only a short session, use a mixed official question set instead. A custom set is not an adaptive Bluebook module. Record where graphing helped and where direct algebra was simpler.
Week 2, Day 7: Write a one-page summary of your method-choice rules. Include when graphing helps, when algebra is faster, and what checks you will always perform.
Troubleshooting Common Issues
No Visible Intercept
If the graph does not show an x-intercept or intersection, the feature may be outside the current window. Adjust the x and y axis ranges. If the intercept is still not visible, solve algebraically. A missing intercept is not proof that no intercept exists.
Two Roots Close Together
If a quadratic has two roots that are close in value, the default zoom may merge them visually. Zoom in on the x-axis around the expected roots. If the roots are still unclear, use factoring or the quadratic formula.
Domain Holes
A rational expression may have a hole where the denominator is zero. The hole may be invisible at the default zoom. Always find the domain restriction algebraically before simplifying. Check any candidate solution against the original expression.
Degree and Radian Setting
If a question involves trigonometric functions, check whether the problem uses degrees or radians. The testing calculator has a mode setting. Using the wrong mode changes the output. This guide does not include trig examples, but the principle applies to any trig question you encounter.
Negative Signs and Parentheses
A missing negative sign or parenthesis changes the entire graph. Type expressions exactly as written. Use parentheses around negative bases, denominators, and exponents. If the graph looks wrong, check the typed expression before adjusting the window.
Changing Calculator Modes
The scientific and graphing calculators are separate modes. Desmos states that content entered in one does not carry to the other. Confirm which mode contains your work before entering a new expression. If you use trigonometric functions, check the relevant angle setting against the units in the question.
Frequently Asked Questions
Can Desmos solve every SAT Math question?
No. Desmos is a graphing and evaluation tool. It does not perform symbolic algebra, establish symbolic equivalence, or replace interpretation. Many questions require algebraic manipulation, domain checking, or reasoning that a graph cannot provide.
Is the embedded Desmos the same as the website version?
The testing version has its own configuration. Use the official testing calculator and current Desmos guidance to check the features you plan to use. Do not assume that an old restriction list describes the current exam tool.
Does using Desmos guarantee a higher score?
No. A calculator is only as useful as the setup and interpretation you bring to it. Incorrect entries, misread features, and ignored domain restrictions produce wrong answers. Method choice and verification matter more than tool availability.
Can I bring a personal formula sheet to the exam?
No. The digital SAT provides a math reference sheet within the Bluebook testing application. You cannot bring your own formula sheet. The reference sheet contains common formulas, but you still need to know how to apply them.
How do I know whether to graph or use algebra?
Ask whether the answer appears as a visible graph feature, whether you can enter the relationship exactly, and whether you can read the feature accurately. If all three are true, graphing may help. If not, use algebra.
What if the graph gives a decimal and the answer choices are fractions?
Use the decimal to identify a possible answer, then verify it exactly. The display 1.333 does not prove 4/3: other values can round similarly. Substitute the candidate fraction into the original equation or solve algebraically when exactness matters.
Can I revisit questions within a module?
According to the College Board Bluebook testing tools page, you can mark questions for review and navigate within the current module. You cannot return to a previous module after it closes. Use the mark-for-review feature strategically.
Next Session
Your next practice session should focus on method choice. Take five official practice questions from the College Board Student Question Bank. For each question, write down whether you would graph or use algebra before solving. Solve the question using your chosen method, then verify your answer by hand. If your chosen method was slow or error-prone, note what you would do differently next time.
For a broader plan that connects calculator practice to the full Math section, see the Aporo digital SAT Math study plan. That page offers a structured approach to domains, practice resources, and review cycles. Use it alongside this guide, not as a replacement for focused calculator practice.
Sources and scope
An AI-assisted guide edited and checked by Aporo. Practice questions, worked examples, illustrative data and proposed routines are original. These are instructional resources, not official questions or calibrated score predictions. Linked sources support the test facts and reference guidance. Illustrations are explanatory, not screenshots or learner results. No score gain is promised.