SAT Math Formulas: A Reference Sheet with Worked Examples
The SAT Math reference sheet supplies several geometry relationships. You also need algebra, percentage, data and trigonometry relationships that the sheet does not list. This guide separates those groups and shows how to select a formula, keep its conditions and check the result. Use the quick table to find a topic, then work through an example before treating the formula as familiar.
Start here
The standard digital SAT Math section has 44 questions across two 35-minute modules, according to the official test structure. You can use an approved calculator throughout the Math section, and Bluebook provides calculator and reference tools. That reference sheet is useful, but it is not a complete collection of every relationship you might need. The official Math overview lists four domains: Algebra, Advanced Math, Problem-Solving and Data Analysis, and Geometry and Trigonometry. This article does not claim that every relationship listed here appears on every test, and it is not an exhaustive list of everything testable. Instead, it is a working reference organized by how formulas actually get used on test day.
Quick Reference Table
| Topic | Relationship | Conditions or notes |
|---|---|---|
| Slope | m = (y₂ − y₁)/(x₂ − x₁) | x₂ ≠ x₁; vertical lines have undefined slope |
| Slope-intercept form | y = mx + b | m is slope, b is y-intercept |
| Standard form | Ax + By = C | A and B are not both zero; if B ≠ 0, slope is −A/B |
| Perpendicular slopes | m₂ = −1/m₁ | Only for finite nonzero slopes; vertical and horizontal lines are the exception pair |
| Quadratic formula | x = (−b ± √(b² − 4ac))/(2a) | a ≠ 0; real solutions require discriminant ≥ 0 |
| Discriminant | D = b² − 4ac | D > 0 two real roots; D = 0 one real root; D < 0 no real roots |
| Vertex form | y = a(x − h)² + k | a ≠ 0; vertex is (h, k) |
| Exponent multiplication | xᵃ · xᵇ = xᵃ⁺ᵇ | x > 0 for arbitrary real exponents; handle zero and negative bases separately |
| Power of a power | (xᵃ)ᵇ = xᵃᵇ | Valid for x > 0 and real exponents; not a blanket rule for negative bases |
| Exponential growth | A = P(1 + r)ᵗ | r as a decimal per period; t is number of periods |
| Percent change | New = Original × (1 ± r) | Apply sequentially for multiple changes |
| Ratio parts | Total ÷ sum of parts = value per part | Multiply each part by the per-part value |
| Distance | d = √((x₂ − x₁)² + (y₂ − y₁)²) | Derived from Pythagorean theorem |
| Midpoint | M = ((x₁ + x₂)/2, (y₁ + y₂)/2) | Average of coordinates |
| Circle area | A = πr² | r is radius |
| Circle circumference | C = 2πr | Also C = πd |
| Arc length | L = (θ/360) · 2πr | θ in degrees; with θ in radians, L = rθ |
| Sector area | A = (θ/360) · πr² | θ in degrees |
| Circle equation | (x − h)² + (y − k)² = r² | Center (h, k), radius r |
| Similar figure scale | Length × k, Area × k², Volume × k³ | Applies when all dimensions scale by k |
| Sine | sin A = opposite/hypotenuse | Right triangles only; angle A is acute |
| Cosine | cos A = adjacent/hypotenuse | Right triangles only |
| Tangent | tan A = opposite/adjacent | Right triangles only |
| Mean | Sum ÷ count | Sensitive to outliers |
| Median | Middle value when ordered | For even count, average the two middle values |
| Probability | P(event) = favorable/total | Equally likely outcomes; watch replacement |
This table is a navigational aid, not a memorization quota. The explanations that follow are where the actual learning happens.
Three Groups of Formulas
A practical way to organize SAT Math formulas is to sort them into three groups. The first group is the geometry reference that the College Board actually supplies during the test. The second group is the additional algebra, data, and trigonometry relationships that you should understand well enough to apply without a reference. The third group is not really a formula list at all. It is the set of definitions and reasoning habits that let you recognize which relationship fits a problem.
Group 1: The Supplied Geometry Reference
The official practice reference page includes the area of a circle, the circumference of a circle, the area of a rectangle, the area of a triangle, the Pythagorean theorem, the side relationships in 30-60-90 and 45-45-90 triangles, and the volume formulas for a rectangular prism, cylinder, sphere, cone, and pyramid. It also states that a circle has 360 degrees or 2π radians and that the angles of a triangle sum to 180 degrees. This reference appears in a nonadaptive paper accommodation practice PDF, so use it to inspect the reference rather than to infer the standard digital test’s timing. Check the current Bluebook sheet during practice. The key point is that these geometry facts are supplied. Prioritize recognizing how to use the supplied relationships before spending time copying them repeatedly. You do need to know that they exist and how to read them under time pressure.
The reference sheet does not include slope, the quadratic formula, percent change, probability, mean, median, arc length, sector area, the standard equation of a circle, or the right-triangle trig ratios. Those are in the second group. Some students waste time memorizing the supplied geometry facts and then freeze on a quadratic because they assumed every formula would be given. The reference sheet is a convenience, not a complete toolkit.
Group 2: Additional Relationships to Understand
This group includes the relationships that appear frequently across the four Math domains and are not on the reference sheet. You should be able to write or apply these without looking them up. The list includes slope and intercept forms, the quadratic formula and discriminant, factoring patterns, vertex form, exponent rules with their domain restrictions, exponential growth multipliers, percent change, ratios and rates, distance and midpoint, circle equations, arc length and sector area, acute right-triangle trig ratios, and the basic statistics and probability relationships.
Understanding matters more than memorizing. For example, you can memorize that perpendicular slopes are negative reciprocals, but you also need to know that this rule fails for vertical and horizontal lines. A vertical line has undefined slope, and a horizontal line has slope 0. They are perpendicular, but you cannot compute a negative reciprocal of 0 or of an undefined slope. Keeping that exception attached to the rule prevents applying a formula where its denominator is not defined.
Group 3: Definitions and Reasoning
Some of the most useful knowledge on the SAT is not a formula at all. It is a definition. Knowing that the y-intercept is the value of y when x equals 0 lets you find it from any form of a line. Knowing that an x-intercept occurs where y equals 0 lets you solve for it directly. Knowing that the median is the middle value when data are ordered, not the middle of the range, prevents a common error. Knowing that probability requires equally likely outcomes for the simple favorable-over-total formula prevents another common error.
Reasoning habits also matter. When a problem gives units, carry them through the calculation. When a problem asks for a percent, decide whether you need a decimal, a fraction, or a percent as the final answer. When a problem involves a figure, check whether the figure is drawn to scale or not. When a problem involves similar figures, identify whether all dimensions scale or only one dimension changes. These habits are not formulas, but they determine whether a formula gets applied correctly.
Slope and Intercepts
Slope measures the rate of change of a line. For two points (x₁, y₁) and (x₂, y₂), the slope is m = (y₂ − y₁)/(x₂ − x₁), provided x₂ ≠ x₁. The numerator is the vertical change, and the denominator is the horizontal change. Slope can be positive, negative, zero, or undefined. A positive slope rises from left to right. A negative slope falls from left to right. A zero slope is a horizontal line. An undefined slope is a vertical line.
The slope-intercept form of a line is y = mx + b, where m is the slope and b is the y-intercept. The y-intercept is the point where the line crosses the y-axis, which occurs when x = 0. The x-intercept is the point where the line crosses the x-axis, which occurs when y = 0.
To find the equation of a line from two points, first compute the slope, then use one point to solve for the y-intercept. Alternatively, use point-slope form, y − y₁ = m(x − x₁), and then convert to slope-intercept form if needed.
Worked Example: Slope from Two Points
Suppose a line passes through the points (−2, 5) and (4, 17). Find the slope, the y-intercept, and the equation of the line in slope-intercept form.
Start with the slope formula. Let (x₁, y₁) = (−2, 5) and (x₂, y₂) = (4, 17). The vertical change is y₂ − y₁ = 17 − 5 = 12. The horizontal change is x₂ − x₁ = 4 − (−2) = 6. The slope is m = 12/6 = 2.
Now use the slope-intercept form y = mx + b. Substitute m = 2 and one of the points, say (−2, 5). Then 5 = 2(−2) + b, so 5 = −4 + b, and b = 9. The equation is y = 2x + 9.
As a check, substitute the other point. When x = 4, y = 2(4) + 9 = 17, which matches. The slope is 2, the y-intercept is 9, and the equation is y = 2x + 9.
Worked Example: Standard Form to Slope-Intercept Form
A line is given by the equation 3x − 2y = 12. Find the slope, the x-intercept, and the y-intercept.
To find the slope, convert to slope-intercept form. Start with 3x − 2y = 12. Subtract 3x from both sides to get −2y = −3x + 12. Divide both sides by −2 to get y = (3/2)x − 6. The slope is 3/2, and the y-intercept is −6.
To find the x-intercept, set y = 0 in the original equation. Then 3x − 2(0) = 12, so 3x = 12, and x = 4. The x-intercept is 4. The y-intercept is −6, which matches the b value in slope-intercept form.
This example shows why converting between forms is useful. Standard form is compact, but slope-intercept form makes the slope and y-intercept immediately visible.
Worked Example: Perpendicular Slope with a Vertical-Horizontal Exception
A line has slope −2/3. A second line is perpendicular to the first and passes through the point (2, 1). Find the equation of the second line.
The negative reciprocal of −2/3 is 3/2. This rule applies because the original slope is finite and nonzero. The perpendicular line therefore has slope 3/2. Using point-slope form with the point (2, 1), the equation is y − 1 = (3/2)(x − 2). Distribute to get y − 1 = (3/2)x − 3. Add 1 to both sides to get y = (3/2)x − 2.
Now consider the exception. If a line has slope 0, it is horizontal. A line perpendicular to it is vertical, which has undefined slope. You cannot compute a negative reciprocal of 0. Similarly, if a line is vertical, its slope is undefined, and a line perpendicular to it is horizontal with slope 0. The negative reciprocal rule applies only to finite nonzero slopes. Vertical and horizontal lines are the paired exception.
Systems of Linear Equations
A system of linear equations asks you to find the point or points where two lines intersect. The three main methods are substitution, elimination, and graphing. The SAT often asks about the number of solutions rather than the exact solution. Two lines can intersect at one point, be parallel with no intersection, or be the same line with infinitely many intersections.
For two nonvertical lines, compare slopes and intercepts to determine the number of solutions. If the slopes are different, the lines intersect at exactly one point. If the slopes are the same but the y-intercepts are different, the lines are parallel and have no solution. If the slopes and y-intercepts are both the same, the lines coincide and have infinitely many solutions. Treat vertical lines separately: x = 2 and x = 5 are parallel, while two copies of x = 2 describe the same line.
Worked Example: Solving a System by Elimination
Consider the system 2x + 3y = 12 and 4x − 3y = 6. Solve for x and y.
Add the two equations. The 3y and −3y terms cancel. The left side becomes 2x + 4x = 6x, and the right side becomes 12 + 6 = 18. So 6x = 18, and x = 3. Substitute x = 3 into the first equation: 2(3) + 3y = 12, so 6 + 3y = 12, 3y = 6, and y = 2. The solution is (3, 2). Check in the second equation: 4(3) − 3(2) = 12 − 6 = 6, which matches.
This example shows why elimination is efficient when the coefficients of one variable are opposites. The method works because adding equations preserves the equality.
Quadratic Formula and Discriminant
A quadratic equation in standard form is ax² + bx + c = 0, where a ≠ 0. The quadratic formula gives the solutions as x = (−b ± √(b² − 4ac))/(2a). The expression under the square root, b² − 4ac, is called the discriminant. The discriminant tells you how many real solutions exist. If the discriminant is positive, there are two distinct real solutions. If it is zero, there is exactly one real solution, sometimes called a repeated root. If it is negative, there are no real solutions, although there are two complex solutions.
The condition a ≠ 0 is essential. If a = 0, the equation is linear, not quadratic, and the quadratic formula does not apply because division by 2a would be division by zero.
Worked Example: Quadratic Formula with a Positive Discriminant
Solve 2x² − 7x + 3 = 0.
Identify a = 2, b = −7, and c = 3. Compute the discriminant: b² − 4ac = (−7)² − 4(2)(3) = 49 − 24 = 25. The discriminant is positive, so there are two real solutions. Apply the quadratic formula: x = (−(−7) ± √25)/(2·2) = (7 ± 5)/4. The two solutions are x = (7 + 5)/4 = 12/4 = 3 and x = (7 − 5)/4 = 2/4 = 1/2. The roots are 3 and 1/2.
As a check, substitute each root into the original equation. For x = 3, 2(9) − 7(3) + 3 = 18 − 21 + 3 = 0. For x = 1/2, 2(1/4) − 7(1/2) + 3 = 1/2 − 7/2 + 3 = −3 + 3 = 0. Both work.
Worked Example: Vertex Form and Minimum Value
Rewrite x² − 8x + 11 in vertex form and find the minimum value.
Complete the square. Start with x² − 8x + 11. Take half of −8, which is −4, and square it to get 16. Add and subtract 16: x² − 8x + 16 − 16 + 11 = (x − 4)² − 5. The vertex form is (x − 4)² − 5. The vertex is (4, −5). Since the coefficient of the squared term is positive, the parabola opens upward, and the vertex is the minimum point. The minimum value is −5, which occurs at x = 4.
Vertex form is useful when a problem asks for the maximum or minimum of a quadratic function. The x-coordinate of the vertex is h, and the y-coordinate is k. For a parabola that opens upward, k is the minimum. For a parabola that opens downward, k is the maximum.
Factoring Patterns
Factoring is often faster than the quadratic formula when the coefficients are small integers. The standard patterns include difference of squares, a² − b² = (a − b)(a + b), and perfect square trinomials, a² + 2ab + b² = (a + b)² and a² − 2ab + b² = (a − b)². For a general quadratic ax² + bx + c, factoring involves finding two numbers that multiply to ac and add to b.
Factoring is not always possible with integer coefficients. The quadratic formula always works for any quadratic with a ≠ 0, which is why it is the more reliable tool when factoring is not obvious.
Worked Example: Factoring a Quadratic
Factor x² − 5x + 6.
Find two numbers that multiply to 6 and add to −5. The numbers are −2 and −3. So x² − 5x + 6 = (x − 2)(x − 3). To solve x² − 5x + 6 = 0, set each factor to zero: x − 2 = 0 gives x = 2, and x − 3 = 0 gives x = 3.
This example is straightforward because the leading coefficient is 1. When the leading coefficient is not 1, the process requires more care, and the quadratic formula may be faster.
Exponents and Domain Restrictions
For a positive real base x and real exponents, the usual product, quotient and power rules apply: xᵃ · xᵇ = xᵃ⁺ᵇ, xᵃ/xᵇ = xᵃ⁻ᵇ, and (xᵃ)ᵇ = xᵃᵇ. Integer exponents permit many negative-base cases too, but do not extend every identity blindly to fractional exponents.
For example, ((−1)²)^(1/2) equals √1 = 1, whereas (−1)^(2 × 1/2) equals −1. Both expressions are defined, yet applying the power-of-a-power identity without its conditions gives different results. The condition is doing real work.
For real arithmetic, (−8)^(1/3) is −2, while (−8)^(1/2) has no real value. A negative exponent requires a nonzero base. Also distinguish √(x²) from x: the principal square root gives |x|. At x = −3, √9 is 3, not −3. Check the original domain before choosing a simplification.
Worked Example: Simplifying Exponents
Simplify (x³y²)² · x⁻⁴y³, assuming x ≠ 0 and y is real.
First apply the power of a power rule to the first factor: (x³y²)² = x⁶y⁴. Now multiply by x⁻⁴y³. For the x terms, x⁶ · x⁻⁴ = x⁶⁻⁴ = x². For the y terms, y⁴ · y³ = y⁴⁺³ = y⁷. The simplified expression is x²y⁷.
The original factor x⁻⁴ requires x ≠ 0. The powers of y in this example have nonnegative integer exponents, so y = 0 is allowed. The simplified expression x²y⁷ is defined at x = 0, but the original expression is not; keep the original restriction.
Exponential Growth and Percent Changes
Exponential growth uses the formula A = P(1 + r)ᵗ, where P is the initial amount, r is the growth rate per period as a decimal, and t is the number of periods. The multiplier (1 + r) is the key. A 4% increase per period means the amount is multiplied by 1.04 each period, not that 4% of the original amount is added each period. The distinction matters because exponential growth compounds.
Simple percent changes use the formula New = Original × (1 ± r). For a percent increase, add r as a decimal to 1. For a percent decrease, subtract r as a decimal from 1. When multiple percent changes occur sequentially, multiply the multipliers in order.
Worked Example: Exponential Growth over Three Periods
A hypothetical population starts at 200 and grows by 4% per period for 3 periods. Find the population after 3 periods.
The growth rate is r = 0.04, so the multiplier is 1.04. The population after 3 periods is 200(1.04)³. Compute 1.04³ = 1.04 × 1.04 × 1.04 = 1.0816 × 1.04 = 1.124864. Multiply by 200 to get 224.9728. If the problem asks for the nearest whole unit, the answer is approximately 225.
Notice that 200 + 3 × 4% of 200 would be 200 + 3 × 8 = 224, which is close but not the same as the compounded result. The difference is small here because the rate and number of periods are small, but it grows larger with higher rates or more periods. The exponential model applies because the growth compounds each period.
Worked Example: Sequential Percent Changes
A quantity of 240 rises by 15% and then falls by 10%. Find the final quantity and the net percent change.
A 15% increase multiplies by 1.15. A 10% decrease multiplies by 0.90. The final quantity is 240 × 1.15 × 0.90. First, 240 × 1.15 = 276. Then 276 × 0.90 = 248.4. The final quantity is 248.4.
The net percent change is the final quantity divided by the original quantity minus 1. Here, 248.4/240 = 1.035, so the net change is a 3.5% increase. The two percent changes do not simply add to a 5% increase because the 10% decrease applies to the larger amount after the 15% increase. Sequential percent changes require multiplication of multipliers, not addition of percents.
Ratios, Rates, and Units
A ratio compares two quantities. A rate is a ratio with different units, such as miles per hour or dollars per pound. When a ratio is given in parts, such as 3:5, the total number of parts is the sum of the parts. To find the actual quantities, divide the total by the sum of the parts to get the value per part, then multiply each part by that value.
Units matter throughout the SAT Math section. Carrying units through a calculation helps catch errors. If a problem asks for a rate in miles per hour and you compute hours per mile, the units will reveal the mistake.
Worked Example: Ratio with a Total
A total of 64 items is split in the ratio 3:5. Find the two quantities.
The sum of the parts is 3 + 5 = 8. The value per part is 64 ÷ 8 = 8. The first quantity is 3 × 8 = 24, and the second quantity is 5 × 8 = 40. The two quantities are 24 and 40, which sum to 64.
This method works for any ratio where the total is known. If the difference between the quantities is known instead, a different setup is needed, but the per-part value remains the key idea.
Distance and Midpoint
The distance between two points (x₁, y₁) and (x₂, y₂) is d = √((x₂ − x₁)² + (y₂ − y₁)²). This formula is the Pythagorean theorem applied to the horizontal and vertical changes. The midpoint of the segment connecting the two points is M = ((x₁ + x₂)/2, (y₁ + y₂)/2), which is the average of the x-coordinates and the average of the y-coordinates.
Worked Example: Distance and Midpoint
Find the distance and midpoint between the points (1, 2) and (7, 10).
The horizontal change is 7 − 1 = 6. The vertical change is 10 − 2 = 8. The distance is √(6² + 8²) = √(36 + 64) = √100 = 10. The midpoint is ((1 + 7)/2, (2 + 10)/2) = (8/2, 12/2) = (4, 6).
The distance formula and midpoint formula are not on the official geometry reference sheet, but they are straightforward applications of the Pythagorean theorem and averaging. Understanding the derivation makes them easier to remember.
Supplied Geometry Reference: What Is Actually Given
The supplied sheet is useful only if you can match its symbols to the figure. In A = bh/2, height h must be perpendicular to the selected base b. In a² + b² = c², c is the side opposite the right angle. In V = πr²h, radius r is half the diameter, and height h is the cylinder’s height.
Write the requested unit before substituting. Area uses square units, while volume uses cubic units. A result can be numerically plausible and still describe the wrong quantity. For a cylinder with radius 3 and height 8, 2πr = 6π measures a circle’s circumference; it does not answer a question asking for the cylinder’s volume. The relationship must match the question before the arithmetic matters.
Worked Example: Triangle Area and Right Triangle Hypotenuse
A triangle has a base of 12 and a perpendicular height of 7. Find its area. Separately, a right triangle has legs of length 5 and 12. Find its hypotenuse.
For the first triangle, the area is A = (1/2)bh = (1/2)(12)(7) = 42. The base and height must be perpendicular. If the given height is not perpendicular to the base, the formula does not apply directly.
For the right triangle, the Pythagorean theorem gives c² = 5² + 12² = 25 + 144 = 169, so c = 13. The hypotenuse is 13. The 5-12-13 relationship is a Pythagorean triple that you can verify from the squares; it is a useful example, not a prediction of a particular test item.
Similar Figures and Scale Factors
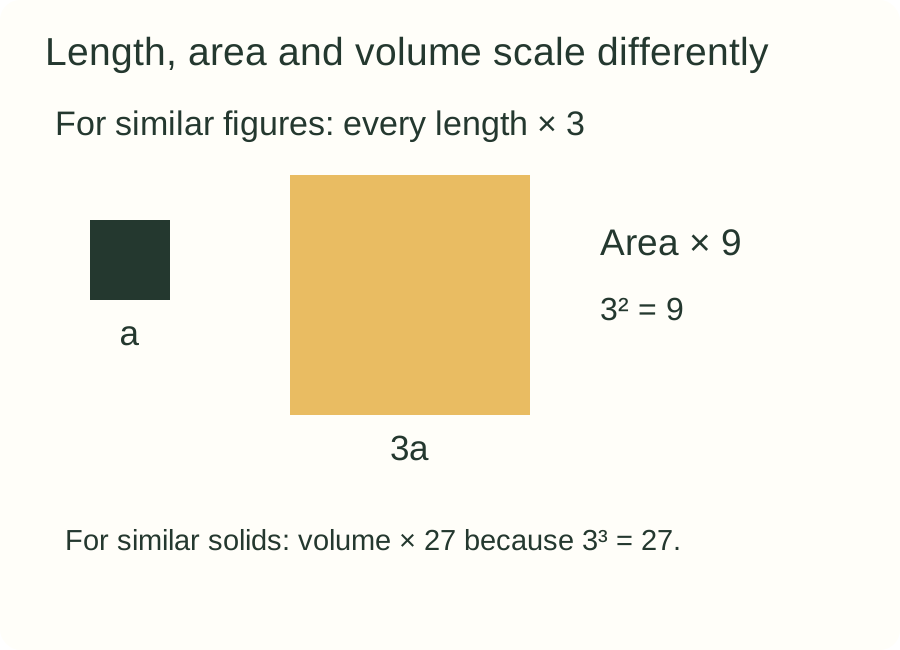
When two figures are similar, all corresponding lengths are proportional. If the scale factor from the smaller figure to the larger figure is k, then every length in the larger figure is k times the corresponding length in the smaller figure. For similar plane figures, the area factor is k². For similar solids, the volume factor is k³.
The area and volume relationships apply only when all dimensions scale by the same factor k. If only one dimension changes, the area and volume relationships are different. For example, if only the radius of a cylinder triples while the height stays the same, the volume multiplies by 3² = 9, not 3³ = 27. The full cubic scaling applies only when the height also triples.
Worked Example: Cylinder Volume and Similar Solids
A cylinder has radius 3 and height 8. Find its volume. Then consider a similar cylinder where all lengths are tripled. Find the new volume and compare it to the original.
The volume of a cylinder is V = πr²h. For the original cylinder, V = π(3²)(8) = π(9)(8) = 72π. The volume is 72π cubic units.
For the similar cylinder with all lengths tripled, the scale factor is k = 3. The new radius is 9, and the new height is 24. The new volume is V = π(9²)(24) = π(81)(24) = 1944π. Compare to the original: 1944π ÷ 72π = 27, which equals 3³. The volume multiplies by 27 when all lengths triple.
Now consider a different scenario. If only the radius triples while the height stays at 8, the new volume is V = π(9²)(8) = π(81)(8) = 648π. Compare to the original: 648π ÷ 72π = 9, which equals 3². Changing only the radius does not triple the height, so the volume multiplies by 9, not 27. The full cubic scaling applies only to similar solids where every length scales by the same factor.
Circle Equations, Arcs, and Sectors
The standard equation of a circle with center (h, k) and radius r is (x − h)² + (y − k)² = r². This equation is not on the official geometry reference sheet, but it follows from the distance formula. Every point (x, y) on the circle is exactly r units from the center.
Arc length and sector area are proportional to the central angle. For a circle of radius r and a central angle of θ degrees, the arc length is L = (θ/360) · 2πr, and the sector area is A = (θ/360) · πr². These formulas are not on the reference sheet either, but they follow from the fact that the full circle has 360 degrees.
Worked Example: Circle, Arc, and Sector
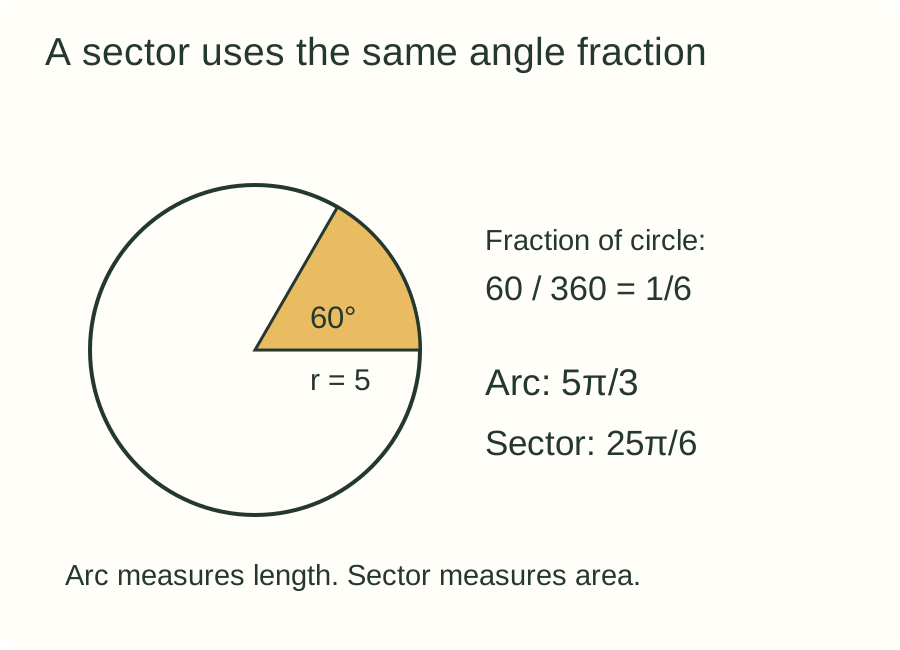
A circle has a diameter of 10. Find its radius, area, and circumference. Then find the arc length and sector area for a 60-degree central angle.
The radius is half the diameter, so r = 5. The area is A = πr² = π(5²) = 25π. The circumference is C = 2πr = 2π(5) = 10π.
For a 60-degree central angle, the arc length is L = (60/360) · 2π(5) = (1/6) · 10π = 5π/3. The sector area is A = (60/360) · π(5²) = (1/6) · 25π = 25π/6.
The fraction 60/360 = 1/6 is the proportion of the full circle represented by the sector. The arc length is 1/6 of the full circumference, and the sector area is 1/6 of the full area.
Right-Triangle Trigonometry
For an acute angle A in a right triangle, the sine, cosine, and tangent ratios are defined as sin A = opposite/hypotenuse, cos A = adjacent/hypotenuse, and tan A = opposite/adjacent. The words "opposite" and "adjacent" are relative to the chosen angle. The side opposite angle A is the side that does not touch angle A. The side adjacent to angle A is the side that touches angle A and is not the hypotenuse.
These ratios are not on the official geometry reference sheet. They are part of the Geometry and Trigonometry domain and should be understood well enough to apply directly.
Worked Example: Trig Ratios in a 3-4-5 Triangle
In a right triangle with sides 3, 4, and 5, let angle A be the angle opposite the side of length 3. Find sin A, cos A, and tan A.
The hypotenuse is the longest side, which is 5. The side opposite angle A is 3. The side adjacent to angle A is 4. Therefore, sin A = 3/5, cos A = 4/5, and tan A = 3/4.
If instead angle A were the angle opposite the side of length 4, the ratios would change. The opposite side would be 4, the adjacent side would be 3, and the ratios would be sin A = 4/5, cos A = 3/5, and tan A = 4/3. Naming the opposite and adjacent sides relative to the chosen angle is essential.
Mean, Weighted Mean, and Median
The mean of a data set is the sum of the values divided by the count. The median is the middle value when the data are ordered from least to greatest. If the count is even, the median is the average of the two middle values. The mean is sensitive to outliers, while the median is resistant to them.
A weighted mean is used when different values have different weights. The weighted mean is the sum of each value times its weight divided by the sum of the weights. For pooled data, use the group sizes as weights when combining group means. Averaging two group means directly only works when their weights are equal. This relationship is not a formula for calculating an SAT scaled score.
Worked Example: Mean, Median, and the Effect of an Outlier
Consider the data set 4, 6, 6, 9, 15. Find the mean, median, and range. Then add the value 20 and find the new mean and median.
The sum is 4 + 6 + 6 + 9 + 15 = 40. The count is 5. The mean is 40/5 = 8. The data are already ordered, so the median is the third value, which is 6. The range is the maximum minus the minimum, which is 15 − 4 = 11.
Now add 20. The new data set is 4, 6, 6, 9, 15, 20. The sum is 40 + 20 = 60. The count is 6. The new mean is 60/6 = 10. The median is the average of the third and fourth values, which are 6 and 9. The new median is (6 + 9)/2 = 7.5.
The mean increased from 8 to 10 because the added value is high. The median increased from 6 to 7.5. The count changed from odd to even, which changed how the median is computed. This example shows why the count matters when finding the median.
Worked Example: Combining Group Means
In an original practice scenario, three objects have a mean mass of 10 grams and seven other objects have a mean mass of 20 grams. What is the mean mass of all ten objects?
Recover the group totals before averaging. The first group has total mass 3 × 10 = 30 grams. The second has total mass 7 × 20 = 140 grams. Together they have 170 grams across 10 objects, so the combined mean is 170/10 = 17 grams.
The tempting calculation (10 + 20)/2 = 15 gives equal weight to the two groups. But one contains three objects and the other contains seven. Each object contributes once to the overall mean, so the larger group has more influence. A result of 17 is between 10 and 20 and closer to 20, which is a useful reasonableness check.
You do not need the individual masses to recover these totals; the definition of the mean supplies them. If the group means were rounded rather than exact, the resulting pooled mean would inherit that uncertainty. Read whether a problem gives exact values, approximations or estimates before reporting unnecessary decimal precision.
Probability with Equally Likely Outcomes
For a situation with equally likely outcomes, the probability of an event is the number of favorable outcomes divided by the total number of outcomes. This formula applies only when every outcome has the same chance of occurring. When items are drawn without replacement, the total number of outcomes changes after each draw, and the probability of subsequent draws depends on earlier draws. With replacement, the original composition is restored. Under independent, uniformly random draws from that restored composition, the next draw has the same probabilities.
Worked Example: Probability with and without Replacement
A container has 5 red and 3 blue items. Two items are drawn at random. Find the probability that both are red if the draws are made without replacement. Then find the probability if the draws are made with replacement.
Without replacement, the probability that the first item is red is 5/8. After drawing one red item, there are 4 red and 3 blue items left, for a total of 7. The probability that the second item is red is 4/7. The probability that both are red is (5/8)(4/7) = 20/56 = 5/14.
With replacement, the probability that the first item is red is 5/8. After replacing the item, the container has the same 5 red and 3 blue items. The probability that the second item is red is again 5/8. The probability that both are red is (5/8)(5/8) = 25/64.
The condition matters. Without replacement, the draws are dependent. With replacement, the draws are independent. Stating the condition is part of answering the question correctly.
The Study Map: Organizing What You Know
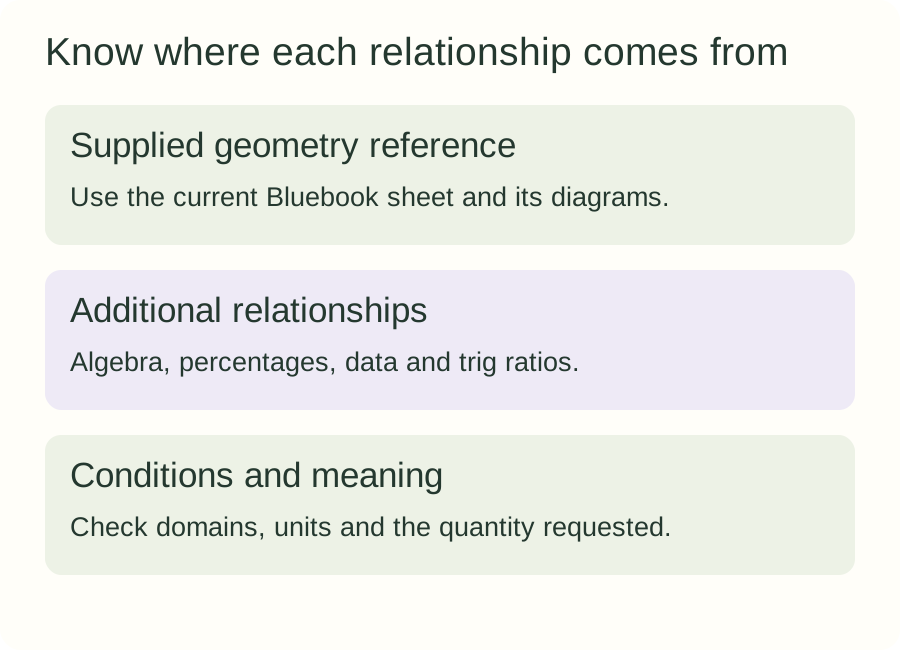
A practical way to study formulas is to separate them into the three groups described earlier. Start with the supplied geometry reference. Read it carefully and make sure you know what is on it and what is not. Then build your understanding of the additional relationships. For each one, write the formula, state the conditions, and work through at least two examples with different numbers. Finally, practice the definitions and reasoning habits. For each definition, such as y-intercept or median, write it in your own words and test yourself with a small example.
The Student Question Bank lets you filter existing official practice questions by domain, skill, and difficulty. This tool does not generate new questions or guarantee unseen questions, but it is useful for targeted practice. Bluebook practice tests provide official full-length adaptive practice with a My Practice review feature. The original practice set in this article is not an official or adaptive test and has no scaled-score conversion.
Practice Set
Try these problems before looking at the answer key. They are original instructional examples, not official SAT questions.
A line passes through the points (−1, 3) and (5, 15). Find the slope, the y-intercept, and the equation of the line.
Solve 3x² − 11x + 6 = 0.
A quantity of 150 decreases by 20% and then increases by 25%. Find the final quantity and the net percent change.
A circle has a radius of 6. Find the arc length and sector area for a 45-degree central angle.
A right triangle has legs of length 8 and 15. Find the hypotenuse and the sine, cosine, and tangent of the angle opposite the side of length 8.
The data set 3, 7, 7, 10, 12, 18 has six values. Find the mean and median.
A container has 4 green and 6 yellow items. Two items are drawn without replacement. Find the probability that both are green.
A cylinder has radius 2 and height 5. A similar cylinder has all lengths doubled. Find the volume of both cylinders and the ratio of the larger volume to the smaller volume.
Answer Key
Slope = (15 − 3)/(5 − (−1)) = 12/6 = 2. Using point (−1, 3), 3 = 2(−1) + b, so b = 5. Equation: y = 2x + 5.
Discriminant = (−11)² − 4(3)(6) = 121 − 72 = 49. Roots: (11 ± 7)/6, so x = 18/6 = 3 and x = 4/6 = 2/3.
150 × 0.80 = 120. Then 120 × 1.25 = 150. Net change: 150/150 = 1, so 0% net change. The decrease and increase offset because the increase applies to a smaller amount.
Arc length = (45/360) · 2π(6) = (1/8) · 12π = 3π/2. Sector area = (45/360) · π(6²) = (1/8) · 36π = 9π/2.
Hypotenuse = √(8² + 15²) = √(64 + 225) = √289 = 17. For the angle opposite the side of length 8, sin = 8/17, cos = 15/17, tan = 8/15.
Sum = 3 + 7 + 7 + 10 + 12 + 18 = 57. Mean = 57/6 = 9.5. Median = (7 + 10)/2 = 8.5.
P(two green) = (4/10)(3/9) = 12/90 = 2/15.
Original volume = π(2²)(5) = 20π. Doubled cylinder has radius 4 and height 10, so volume = π(4²)(10) = 160π. Ratio = 160π/20π = 8, which equals 2³.
How to Use This Reference While Studying
The goal is not to memorize a long list. The goal is to recognize which relationship applies to a problem and to apply it with the right conditions and units. Use the following process to connect the question with a relationship.
First, when you encounter a problem, identify what the problem is asking for. Is it asking for a slope, a root, a probability, a volume, a mean? The wording usually signals the topic. Second, identify what information is given. Are you given two points, an equation, a data set, a diagram? Third, select the relationship that connects the given information to the requested quantity. Fourth, apply the relationship carefully, carrying units and checking conditions. Fifth, check whether the answer makes sense. Does the slope have the right sign? Does the probability fall between 0 and 1? Does the volume have cubic units?
This process is more valuable than copying formulas repeatedly. The SAT rewards selection and application, not recall alone. A student who has memorized the quadratic formula but does not recognize when to use it will not benefit. A student who understands that a quadratic equation with a negative discriminant has no real solutions can answer a conceptual question without solving anything.
Frequently Asked Questions
Do I need to memorize the geometry reference sheet?
No. The College Board supplies the geometry reference during the test through the Bluebook testing application. You do need to know what is on it and how to use it quickly. You also need to know that many other relationships, such as slope, the quadratic formula, and trig ratios, are not on it.
Can I bring my own formula sheet?
No. The SAT does not allow personal formula sheets. Use the supplied Bluebook reference during standard testing; follow any separately approved accommodations and current official instructions. This article is a study resource, not something you can bring to the test.
Is the Desmos calculator available for every Math question?
Yes. According to the College Board's published calculator policy, calculators are allowed throughout the Math section, and the embedded Desmos scientific and graphing calculator is available in Bluebook. CAS handheld functionality is prohibited, and you should check current restrictions rather than relying on an old calculator list.
How many formulas do I need to memorize?
There is no exact number, and this article does not claim one. The supplied geometry reference covers several formulas. The additional relationships in this article are important to understand, but the goal is application, not a memorization quota. Focus on the relationships that appear in your practice and on the conditions that make them valid.
What if I forget a formula during the test?
For many formulas, you can derive them from simpler ideas. The distance formula is the Pythagorean theorem. The midpoint formula is an average. Arc length and sector area are fractions of the full circle. The vertex form of a quadratic comes from completing the square. Building these derivations during study reduces the chance of forgetting.
Does the SAT test every formula in this article?
No. The College Board publishes four Math domains, but it does not guarantee that every listed relationship appears on every test. This article is a reference, not a prediction of specific test content.
How should I practice with the Student Question Bank?
The College Board's Student Question Bank lets you filter existing official practice questions by domain, skill, and difficulty. Use it to target the topics where you need the most work. It does not generate new questions or guarantee unseen questions, but it is a useful supplement to full practice tests.
Are the practice questions in this article official?
No. The worked examples and practice set in this article are original instructional material. They are not official SAT questions, not adaptive, and have no scaled-score conversion. Use them to build understanding, then practice with official materials.
Final Next Action
Pick one formula group from this article that feels least familiar. Work through the relevant worked example again, then write your own example with different numbers and solve it. Check your answer against the method shown here. Then find two or three official practice questions on the same topic using the College Board's Student Question Bank or Bluebook practice tests. This targeted cycle builds the selection and application skills that the SAT actually tests.
If you want a broader plan for organizing your SAT Math preparation, see the published study plan at Digital SAT Math Study Plan. It provides a structure for sequencing your practice across the four Math domains.
Sources and scope
An AI-assisted guide edited and checked by Aporo. Practice questions, worked examples, illustrative data and proposed routines are original. These are instructional resources, not official questions or calibrated score predictions. Linked sources support the test facts and reference guidance. Illustrations are explanatory, not screenshots or learner results. No score gain is promised.